Attrition Analysis
I performed HR data analysis to identify key patterns and factors behind employee attrition.
(Client)
Anonym
(Year)
2024
(Services)
Data Analytics
Disclaimer: The dataset used in this project is publicly available on Kaggle and does not represent real data from a specific organization. However, the analysis and insights are presented as if they were performed for a real company case.
This project simulates a real-world employee attrition analysis for a company, aimed at uncovering key patterns and factors contributing to employee turnover. The insights generated mirror how an actual HR data analysis would be conducted in a corporate setting.
📌 Objectives:
Understand the overall attrition rate within the company.
Identify key factors influencing employee turnover.
Provide data-driven strategies to improve retention.
🧪 Methodology:
Data Cleaning
Removed duplicates, handled missing values, corrected data types.
Exploratory Data Analysis (EDA)
Conducted summary statistics and visual exploration to understand the relationship between attrition and various factors like job role, income, marital status, and tenure.
Pivot Table Analysis
Built pivot tables to compare attrition across job roles, marital status, and income brackets.
Visualization
Used spreadsheet-based charts and graphs to visualize key trends and findings.
🔍 Key Insights:
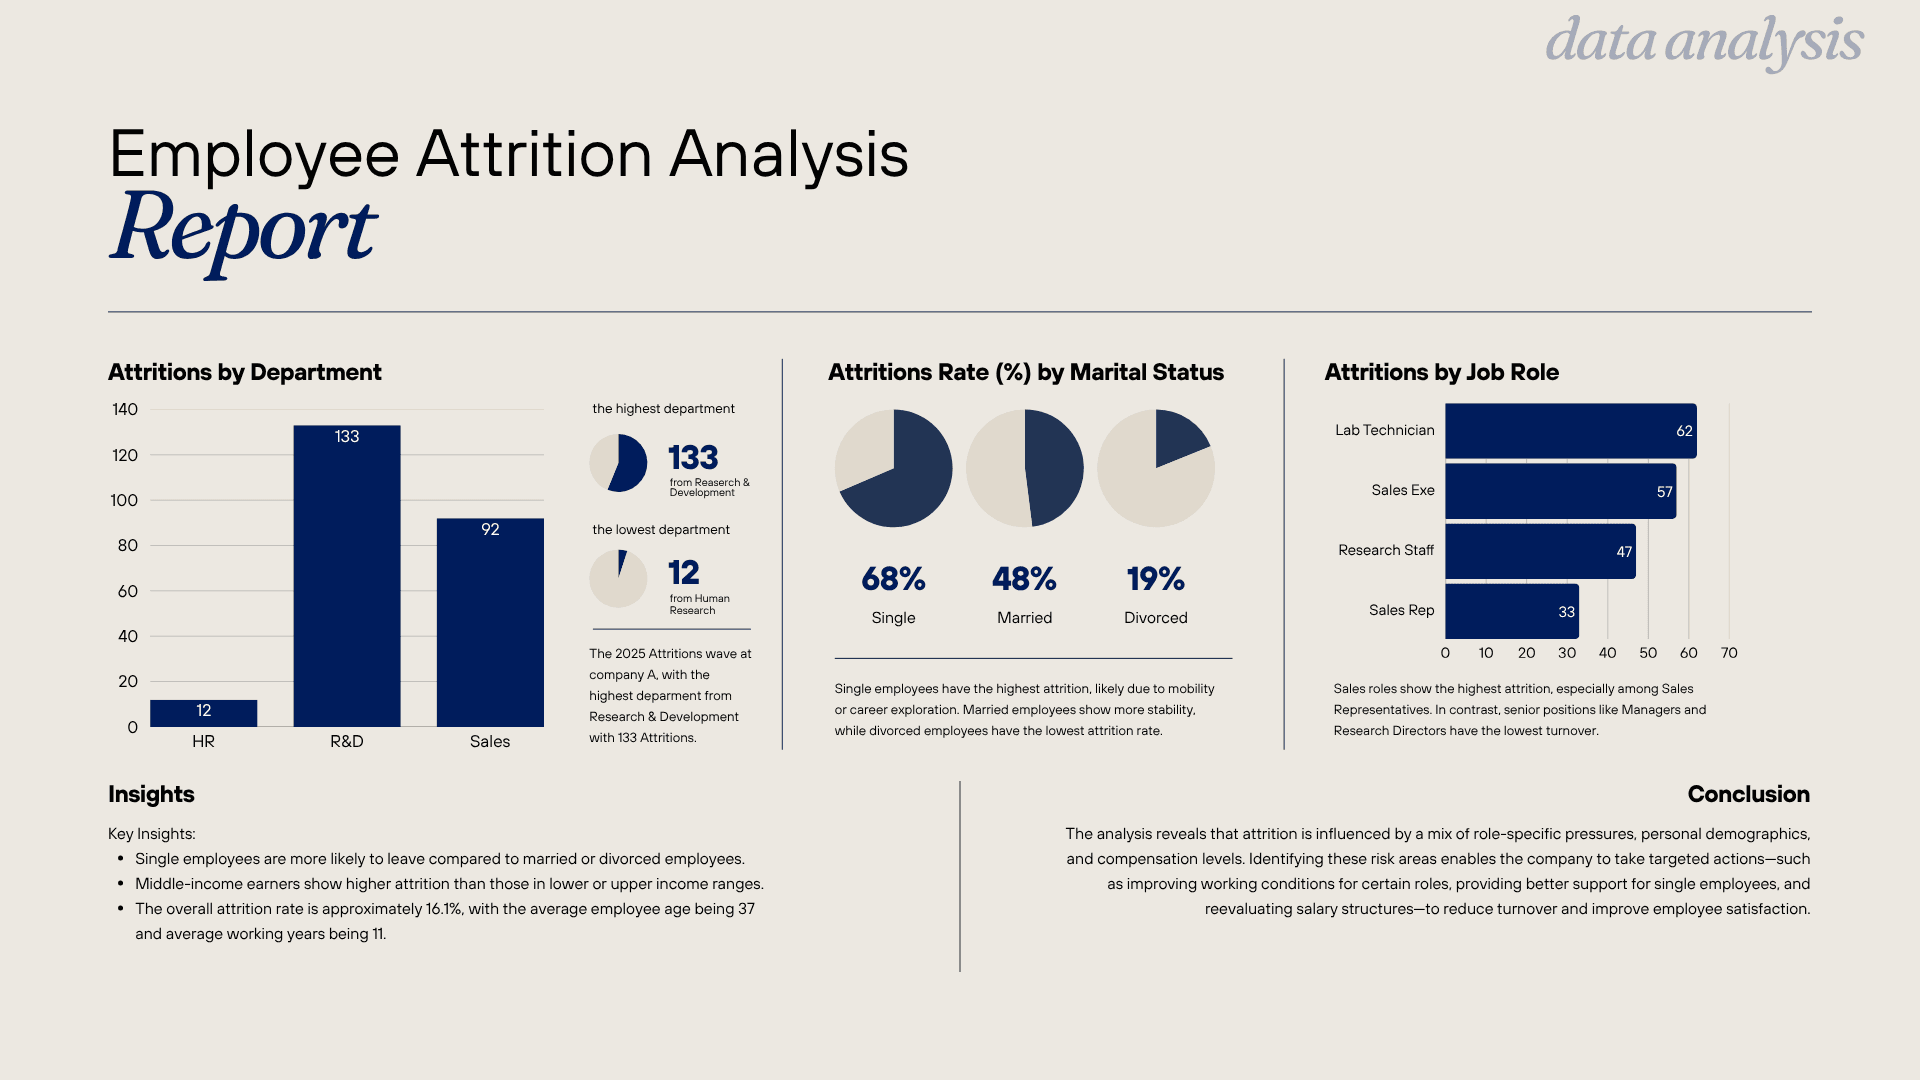
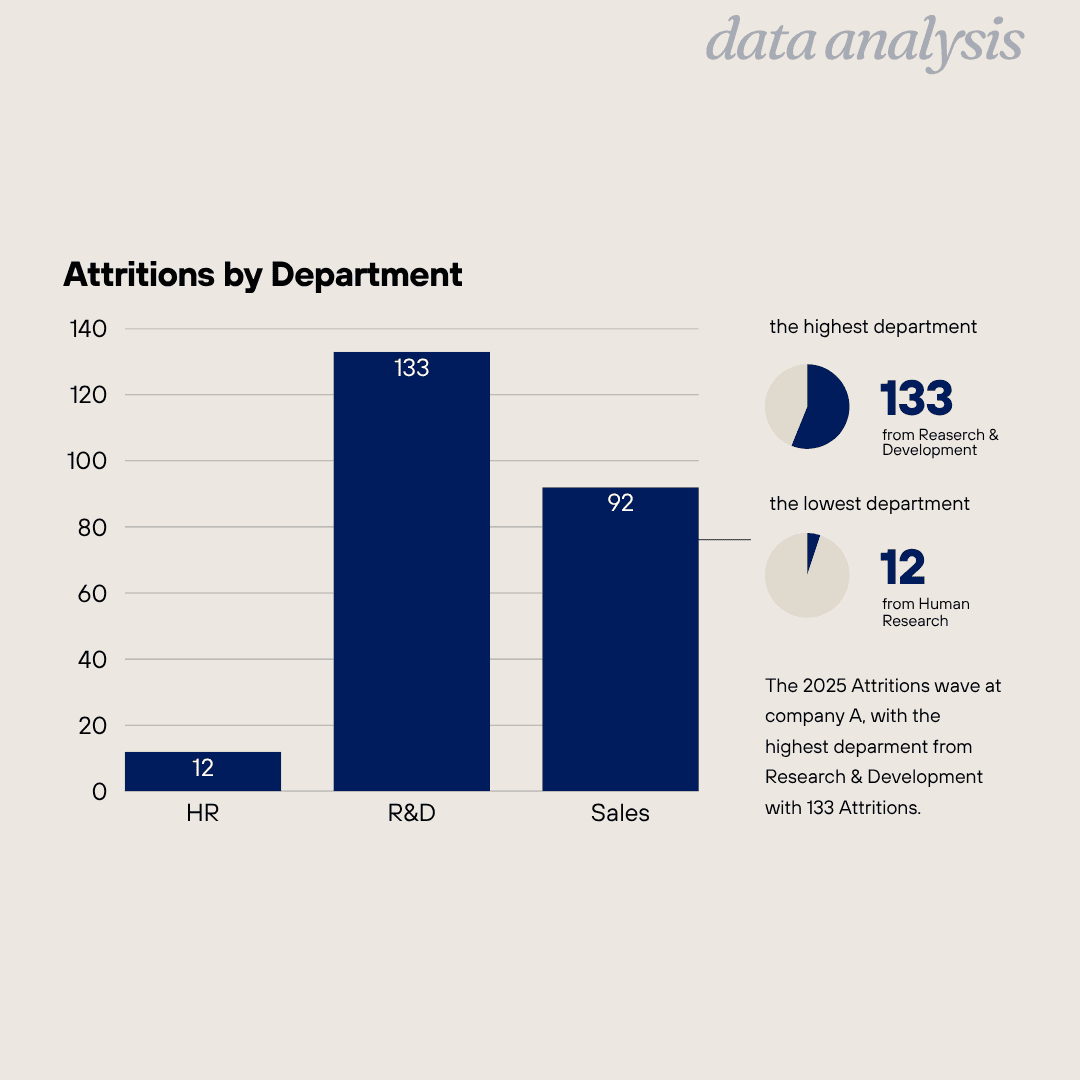
Sales Representatives and Laboratory Technicians experience the highest attrition rates.
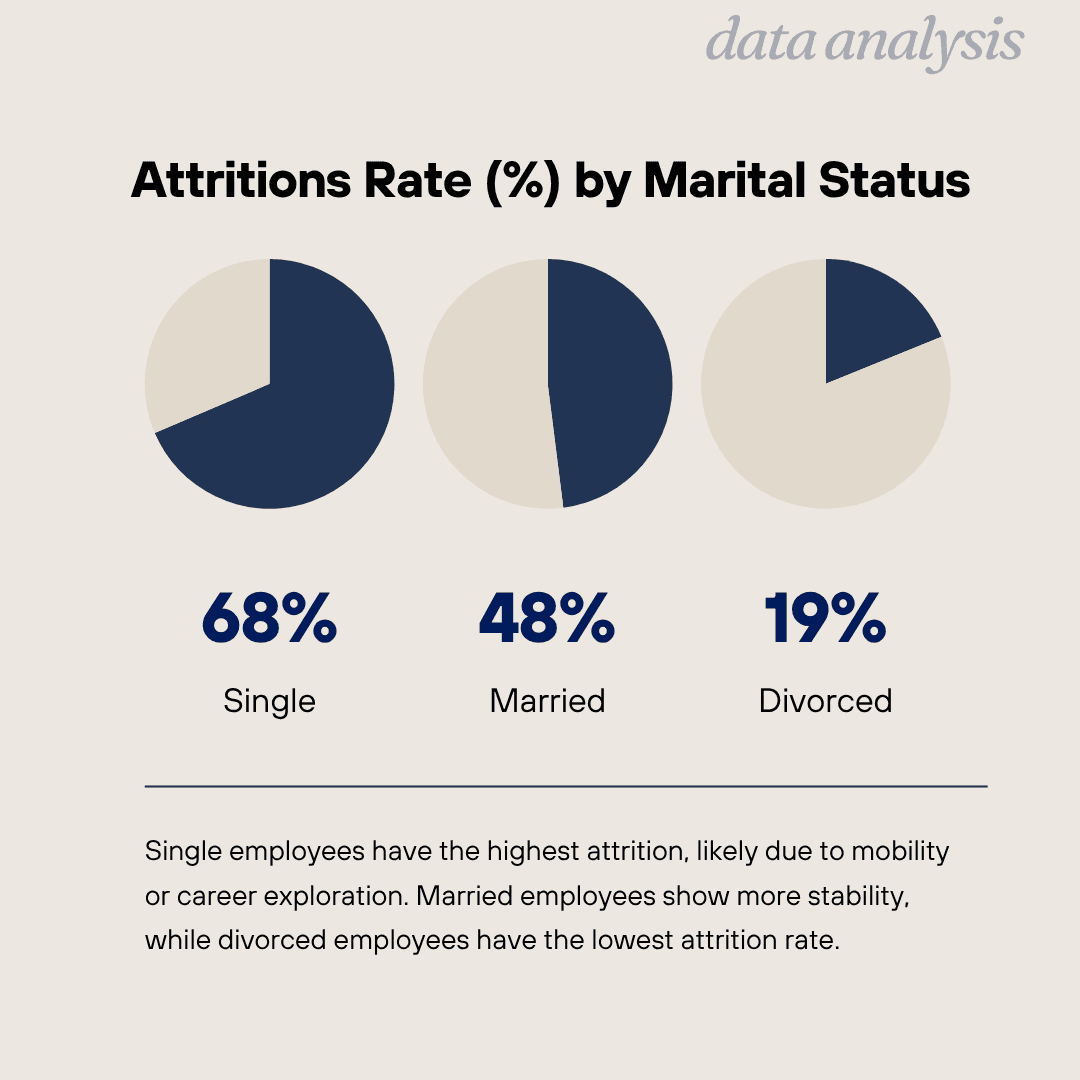
Single employees are more prone to leaving the company than married or divorced ones.
Employees in the middle-income range tend to have higher attrition compared to lower and higher earners.
All employees appear to be working overtime, which suggests a data anomaly or a company-wide policy worth further investigation.
The overall attrition rate is 16.1%, with the average employee age being 37 and average total working years being 11.
✅ Conclusion:
Although this project is based on public data, the analytical approach mirrors real business applications. The findings highlight how HR and leadership teams can use employee data to identify at-risk groups and take proactive measures, such as improving work conditions for specific job roles, offering support for younger or single employees, and reviewing compensation structures to reduce attrition and enhance employee retention.

Attrition Analysis
I performed HR data analysis to identify key patterns and factors behind employee attrition.
(Client)
Anonym
(Year)
2024
(Services)
Data Analytics
Disclaimer: The dataset used in this project is publicly available on Kaggle and does not represent real data from a specific organization. However, the analysis and insights are presented as if they were performed for a real company case.
This project simulates a real-world employee attrition analysis for a company, aimed at uncovering key patterns and factors contributing to employee turnover. The insights generated mirror how an actual HR data analysis would be conducted in a corporate setting.
📌 Objectives:
Understand the overall attrition rate within the company.
Identify key factors influencing employee turnover.
Provide data-driven strategies to improve retention.
🧪 Methodology:
Data Cleaning
Removed duplicates, handled missing values, corrected data types.
Exploratory Data Analysis (EDA)
Conducted summary statistics and visual exploration to understand the relationship between attrition and various factors like job role, income, marital status, and tenure.
Pivot Table Analysis
Built pivot tables to compare attrition across job roles, marital status, and income brackets.
Visualization
Used spreadsheet-based charts and graphs to visualize key trends and findings.
🔍 Key Insights:
Sales Representatives and Laboratory Technicians experience the highest attrition rates.
Single employees are more prone to leaving the company than married or divorced ones.
Employees in the middle-income range tend to have higher attrition compared to lower and higher earners.
All employees appear to be working overtime, which suggests a data anomaly or a company-wide policy worth further investigation.
The overall attrition rate is 16.1%, with the average employee age being 37 and average total working years being 11.
✅ Conclusion:
Although this project is based on public data, the analytical approach mirrors real business applications. The findings highlight how HR and leadership teams can use employee data to identify at-risk groups and take proactive measures, such as improving work conditions for specific job roles, offering support for younger or single employees, and reviewing compensation structures to reduce attrition and enhance employee retention.