Sales Analysis
A data analytics project focused on supermarket sales, exploring customer behavior, product performance, and branch profitability using Python and visualizations.
(Client)
Anonym
(Year)
2025
(Services)
Data Analysis
Disclaimer: The dataset used in this project is publicly available on Kaggle and does not represent real data from a specific organization. However, the analysis and insights are presented as if they were performed for a real company case.
This project performs an Exploratory Data Analysis (EDA) on supermarket transaction data using pure Python and terminal output (no dashboard or web app). The purpose is to extract business insights from customer purchases across branches, product lines, and customer demographics.
📌 Project Summary
This analysis was built using a standalone Python script (main.py) that outputs results and insights directly to the terminal, including statistical summaries and visualizations.
🎯 Goals of the Project
Analyze revenue trends and top-selling products
Understand branch-wise sales performance
Examine customer patterns by type and gender
Evaluate gross income and profit margins
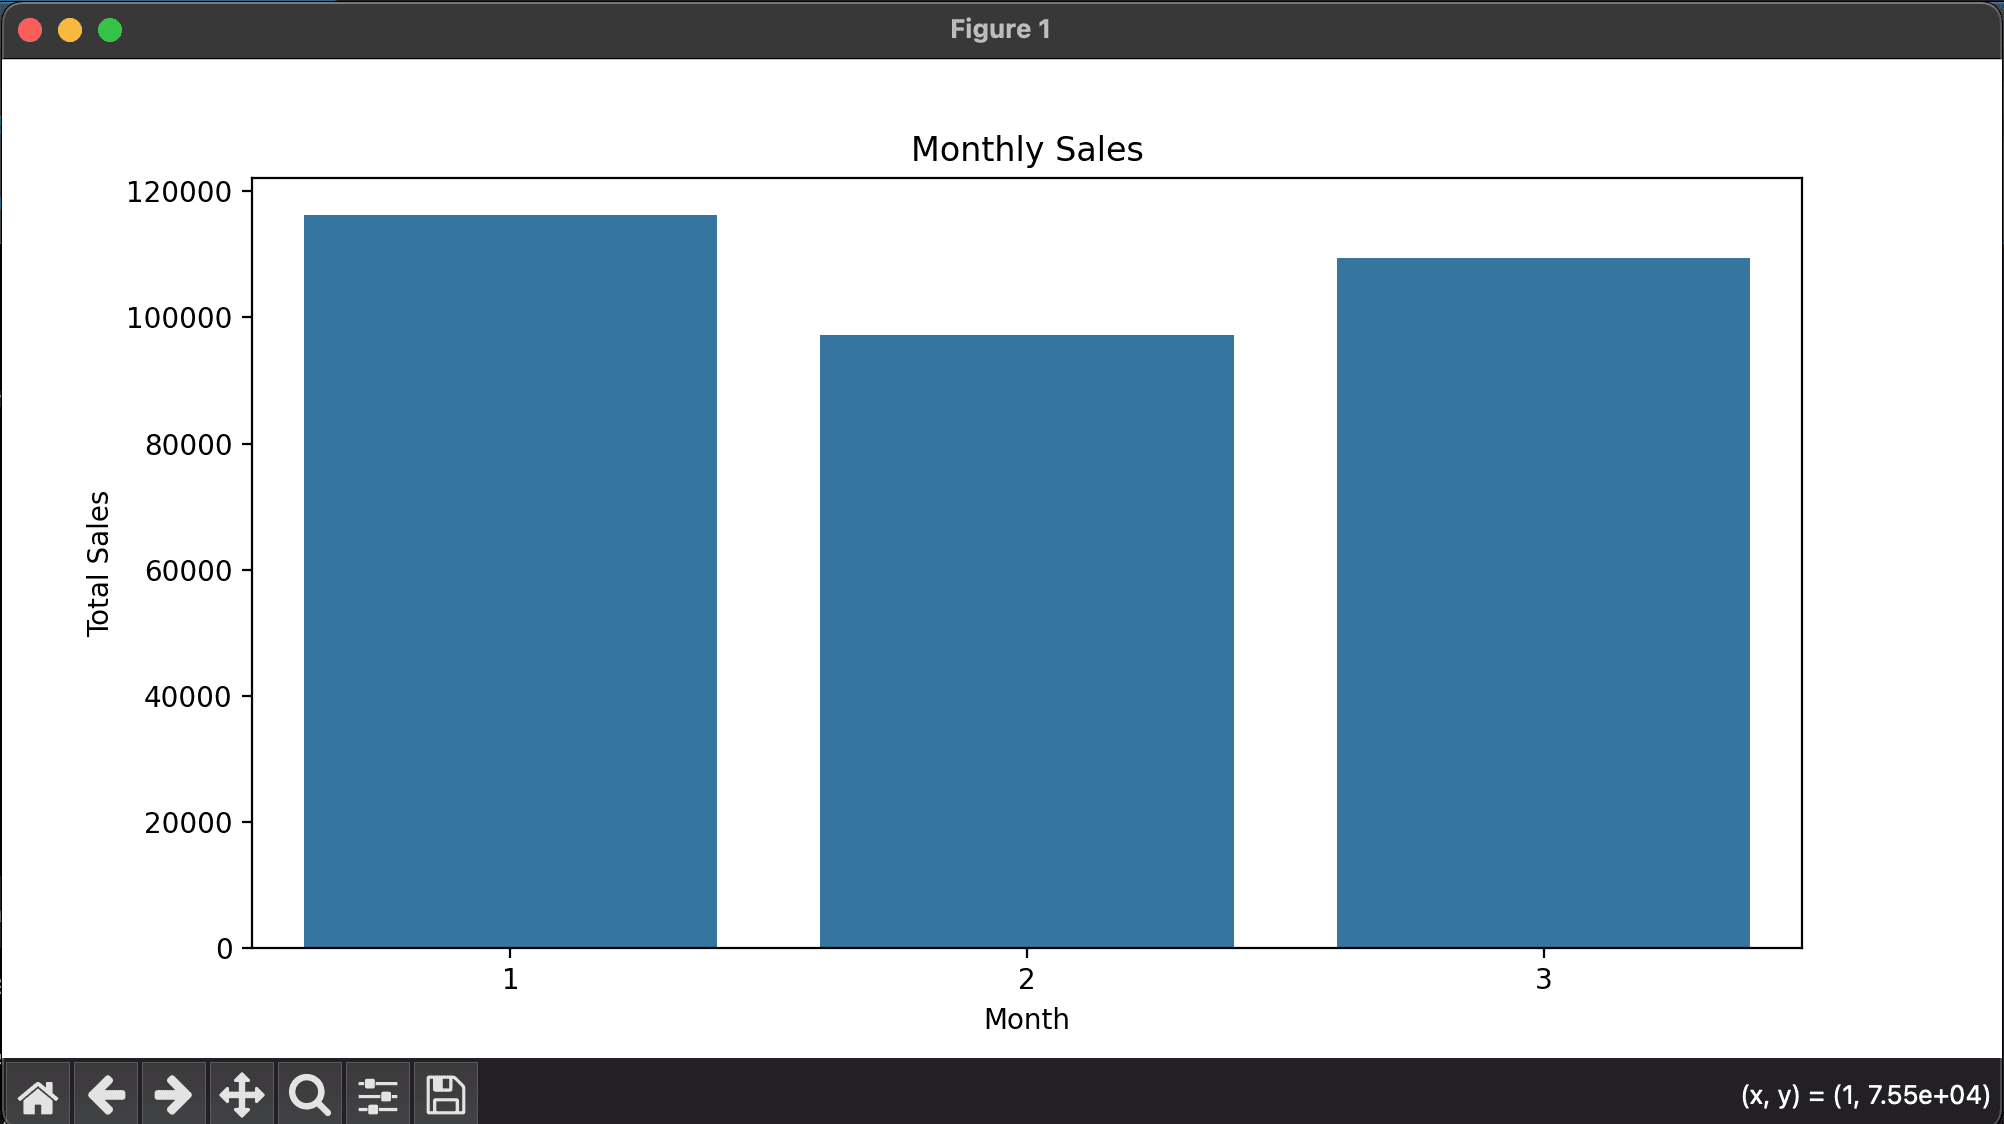
Visualize invoice value distribution and monthly trends
🧪 Methodology:
Data Cleaning
Removed duplicates, handled missing values, corrected data types.
Exploratory Data Analysis (EDA)
Conducted summary statistics and visual exploration to understand the relationship between attrition and various factors like job role, income, marital status, and tenure.
Pivot Table Analysis
Built pivot tables to compare attrition across job roles, marital status, and income brackets.
Visualization
Used spreadsheet-based charts and graphs to visualize key trends and findings.
📊 Insights from the Data
✅ Dataset Overview
1,000 rows with 17 features
No missing/null values
Key metrics include:
Total,Quantity,Gross income,Branch,Product line,Customer type, andRating.
🔢 Statistical Summary
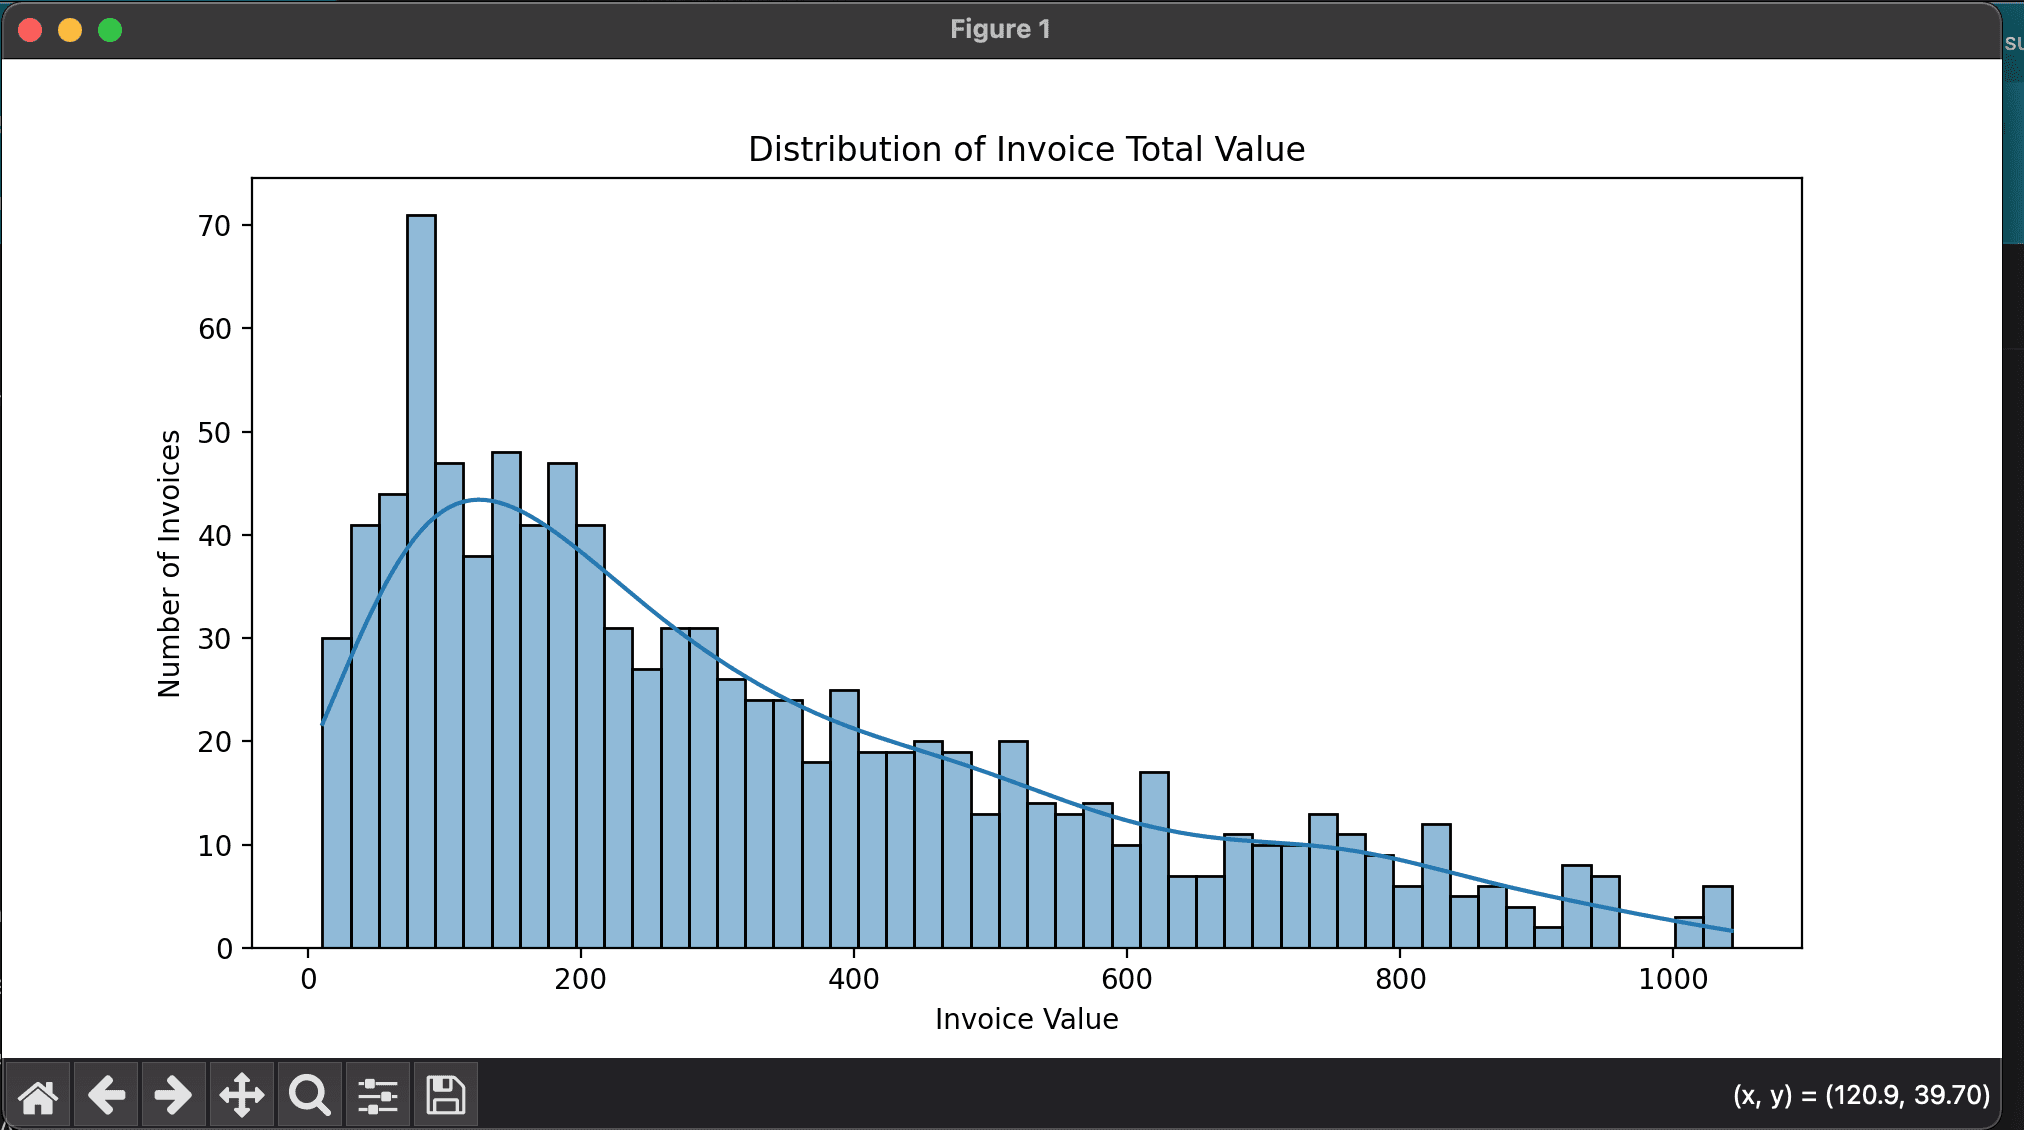
Average Sale per Invoice: ~$322.97
Max Invoice Value: $1,042.65
Average Gross Income per Sale: ~$15.38
Gross Margin Percentage: Constant at 4.76%
🏆 Top-Selling Product Lines (by Revenue)
Food and Beverages – $56,144
Sports and Travel – $55,122
Electronic Accessories – $54,337
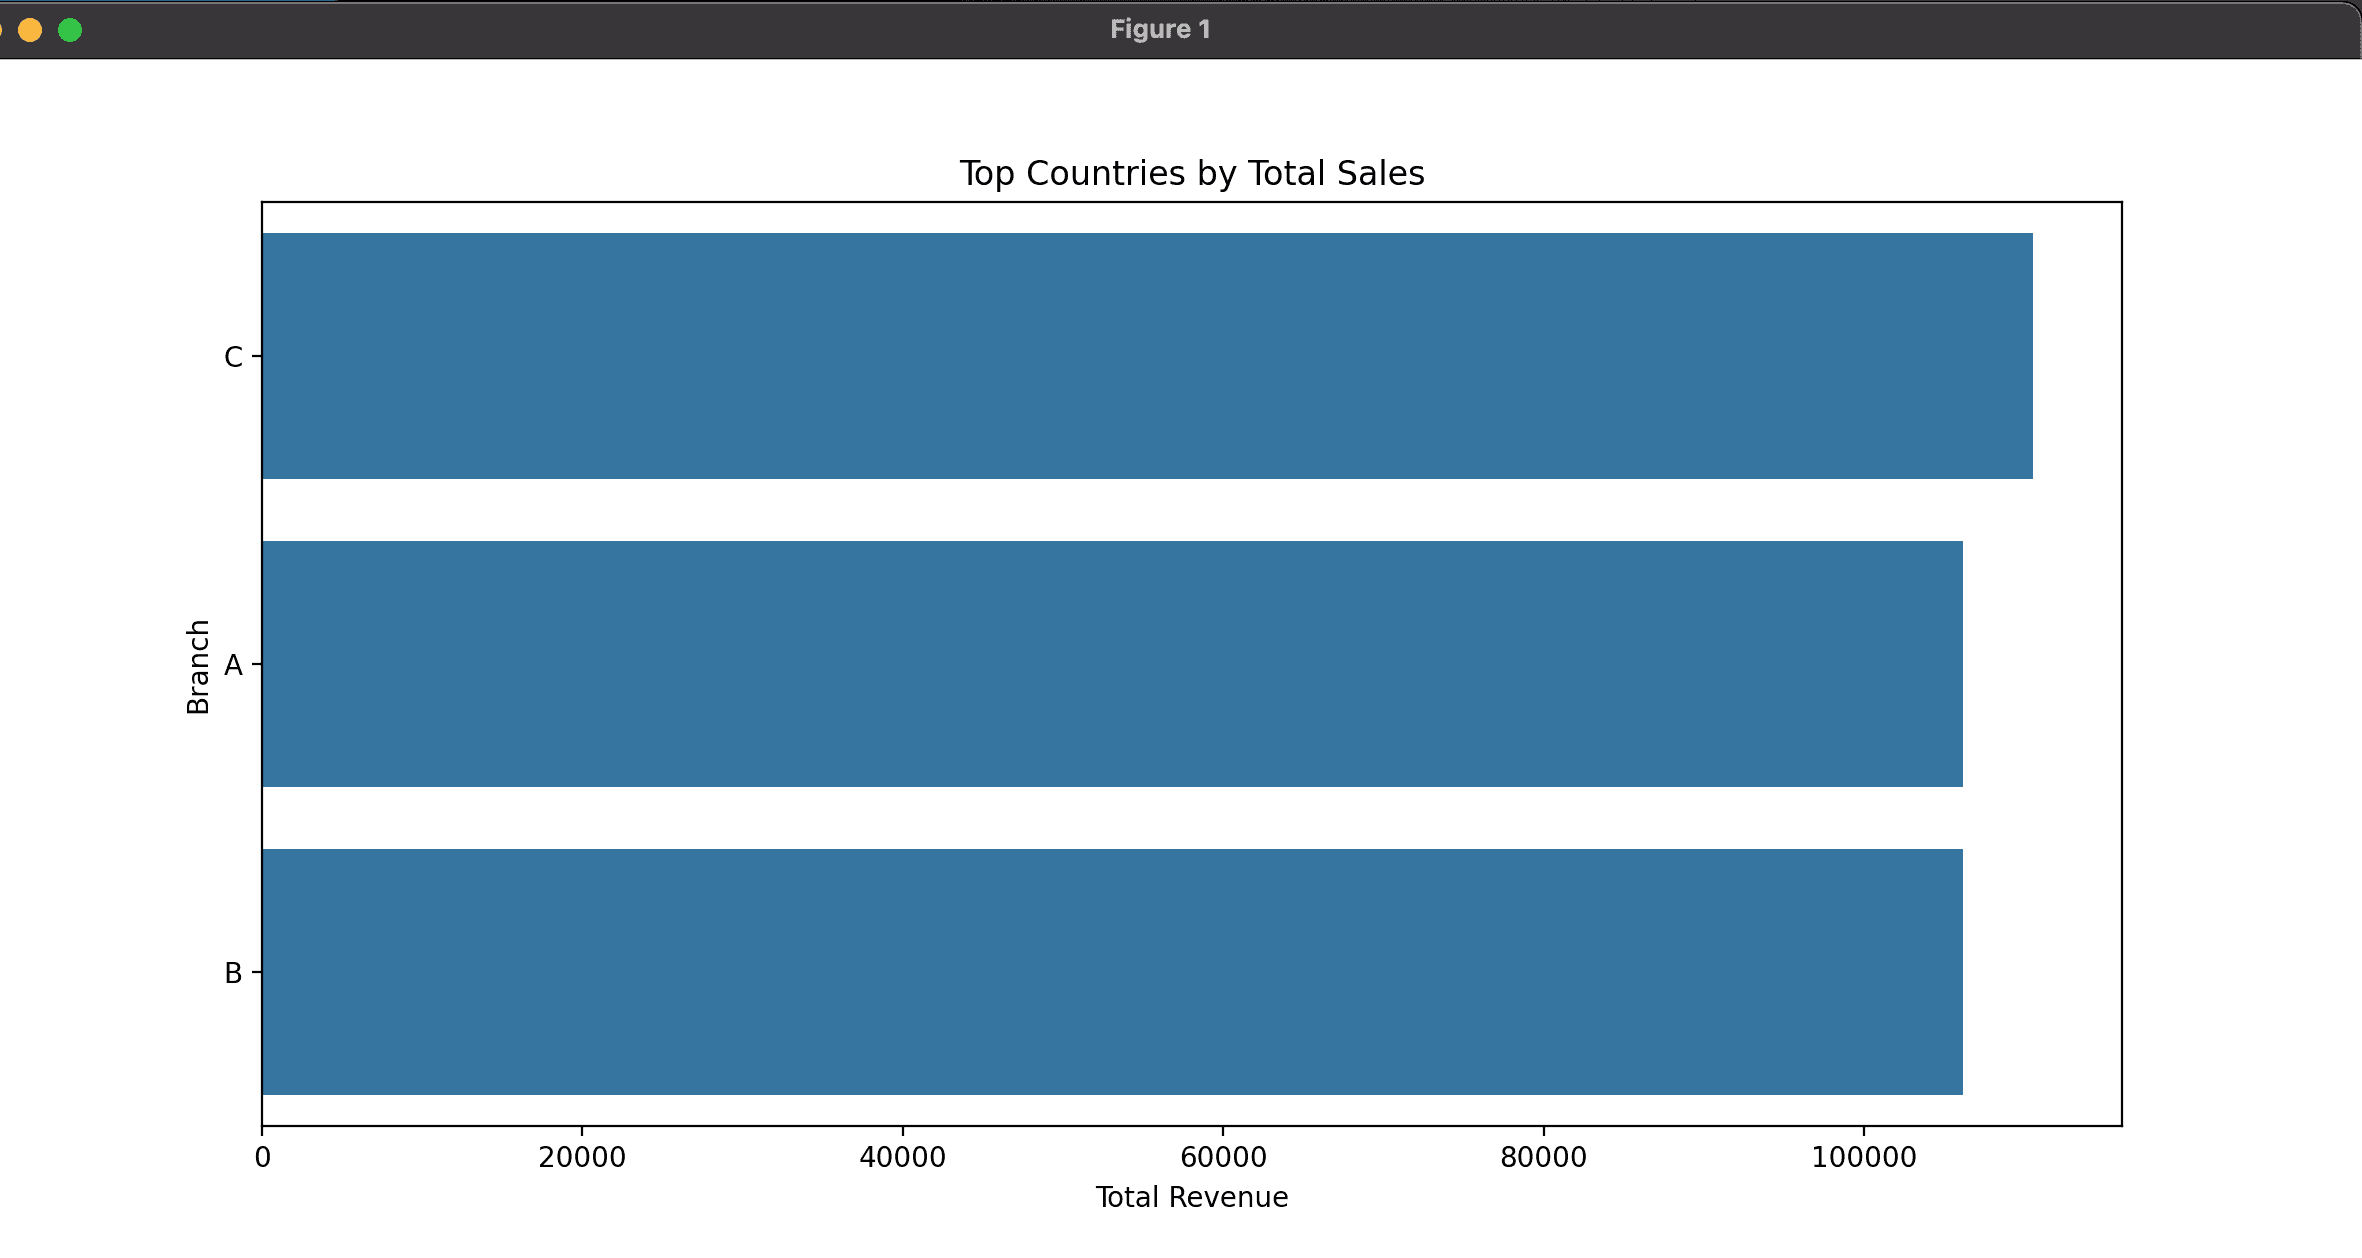
🏢 Total Sales by Branch
Branch C leads with $110,568
Followed by Branch A and B with similar sales (~$106,200)
🛠️ Technologies Used
Python 3 Pandas Seaborn Matplotlib
📄 License
This project is open for educational and personal use.
🙌 Acknowledgements
Dataset sourced from public Kaggle repositories. Analysis and script developed as a data analytics portfolio project.

Sales Analysis
A data analytics project focused on supermarket sales, exploring customer behavior, product performance, and branch profitability using Python and visualizations.
(Client)
Anonym
(Year)
2025
(Services)
Data Analysis
Disclaimer: The dataset used in this project is publicly available on Kaggle and does not represent real data from a specific organization. However, the analysis and insights are presented as if they were performed for a real company case.
This project performs an Exploratory Data Analysis (EDA) on supermarket transaction data using pure Python and terminal output (no dashboard or web app). The purpose is to extract business insights from customer purchases across branches, product lines, and customer demographics.
📌 Project Summary
This analysis was built using a standalone Python script (main.py) that outputs results and insights directly to the terminal, including statistical summaries and visualizations.
🎯 Goals of the Project
Analyze revenue trends and top-selling products
Understand branch-wise sales performance
Examine customer patterns by type and gender
Evaluate gross income and profit margins
Visualize invoice value distribution and monthly trends
🧪 Methodology:
Data Cleaning
Removed duplicates, handled missing values, corrected data types.
Exploratory Data Analysis (EDA)
Conducted summary statistics and visual exploration to understand the relationship between attrition and various factors like job role, income, marital status, and tenure.
Pivot Table Analysis
Built pivot tables to compare attrition across job roles, marital status, and income brackets.
Visualization
Used spreadsheet-based charts and graphs to visualize key trends and findings.
📊 Insights from the Data
✅ Dataset Overview
1,000 rows with 17 features
No missing/null values
Key metrics include:
Total,Quantity,Gross income,Branch,Product line,Customer type, andRating.
🔢 Statistical Summary
Average Sale per Invoice: ~$322.97
Max Invoice Value: $1,042.65
Average Gross Income per Sale: ~$15.38
Gross Margin Percentage: Constant at 4.76%
🏆 Top-Selling Product Lines (by Revenue)
Food and Beverages – $56,144
Sports and Travel – $55,122
Electronic Accessories – $54,337
🏢 Total Sales by Branch
Branch C leads with $110,568
Followed by Branch A and B with similar sales (~$106,200)
🛠️ Technologies Used
Python 3 Pandas Seaborn Matplotlib
📄 License
This project is open for educational and personal use.
🙌 Acknowledgements
Dataset sourced from public Kaggle repositories. Analysis and script developed as a data analytics portfolio project.